National Park Service
Park Tiles
2016–current. Vector basemap suite published using Mapbox Atlas. Data compiled in QGIS and PostgreSQL/PostGIS. Click image to view interactive version of Park Tiles Standard.
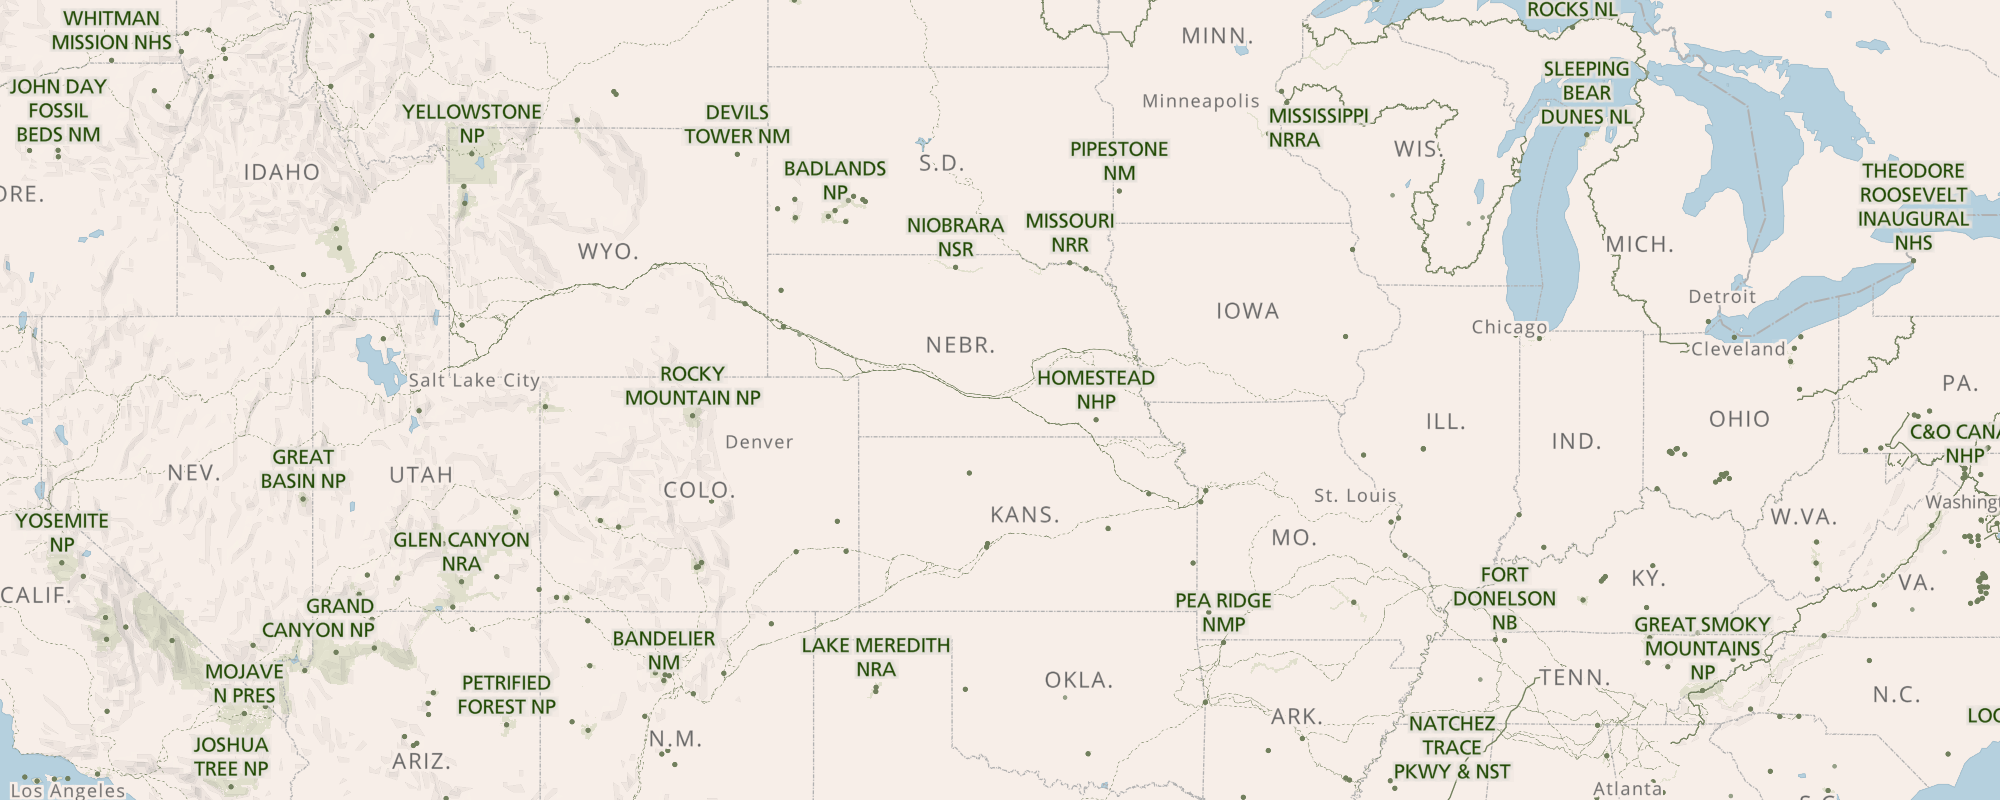
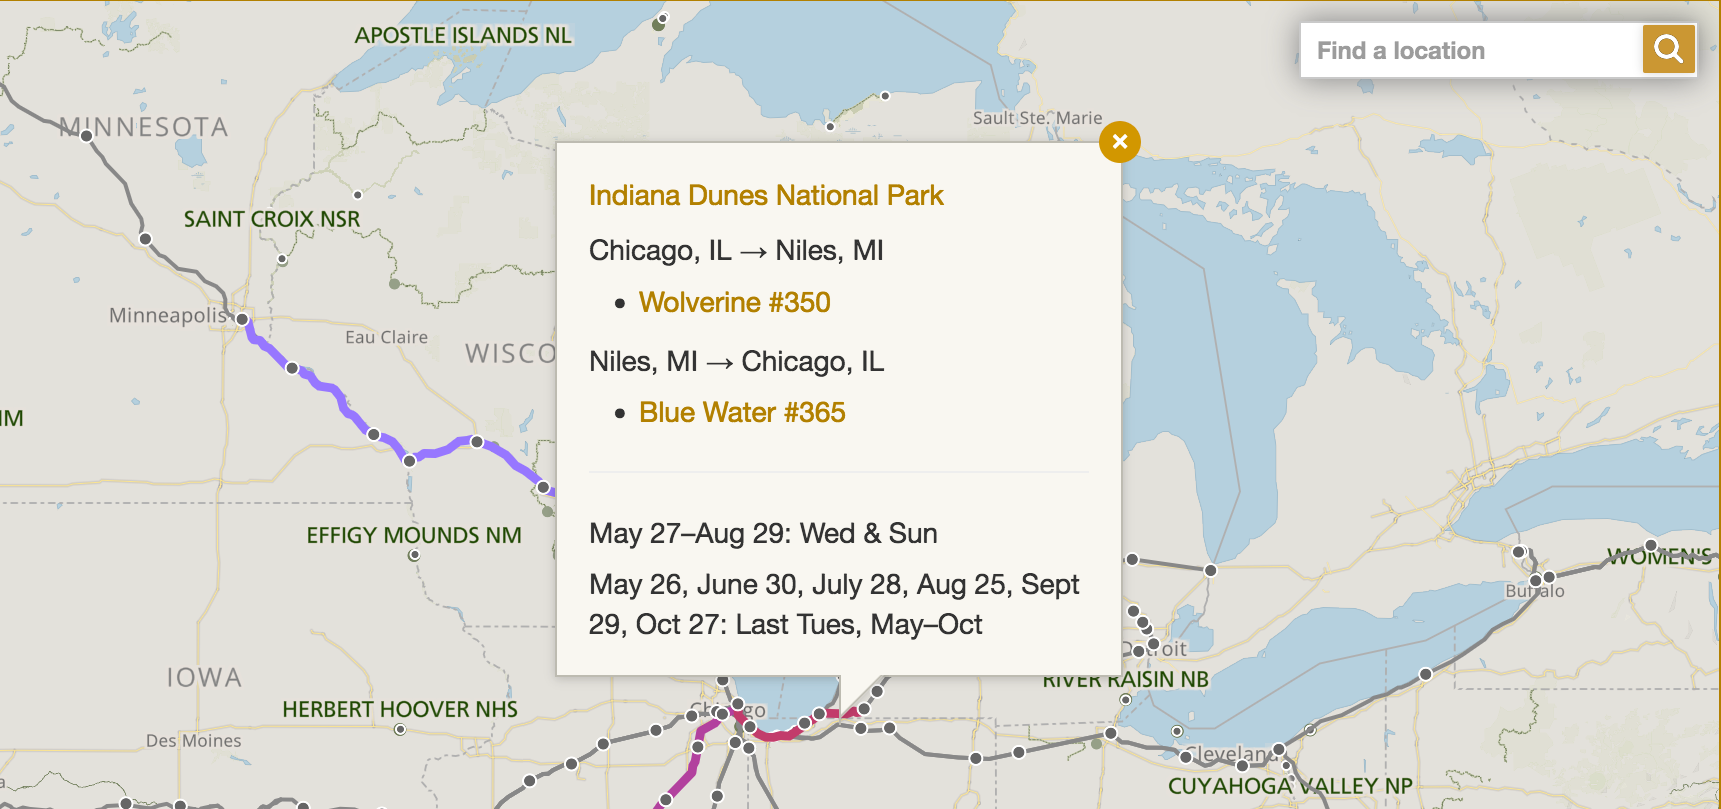
Park Tiles is the general-use, visitor-oriented basemap suite for National Park Service interactive map applications. Park Tiles adapts the cartographic traditions of the NPS for the web to strengthen NPS graphic identity across all platforms. Live examples can be viewed on the NPS maps page, the Yellowstone Live Roads map, and Golden Gate NRA, among many others. Park Tiles basemaps are also used in the NPS Mobile App. Read more about how Park Tiles integrates with the map stack my team develops and maintains.
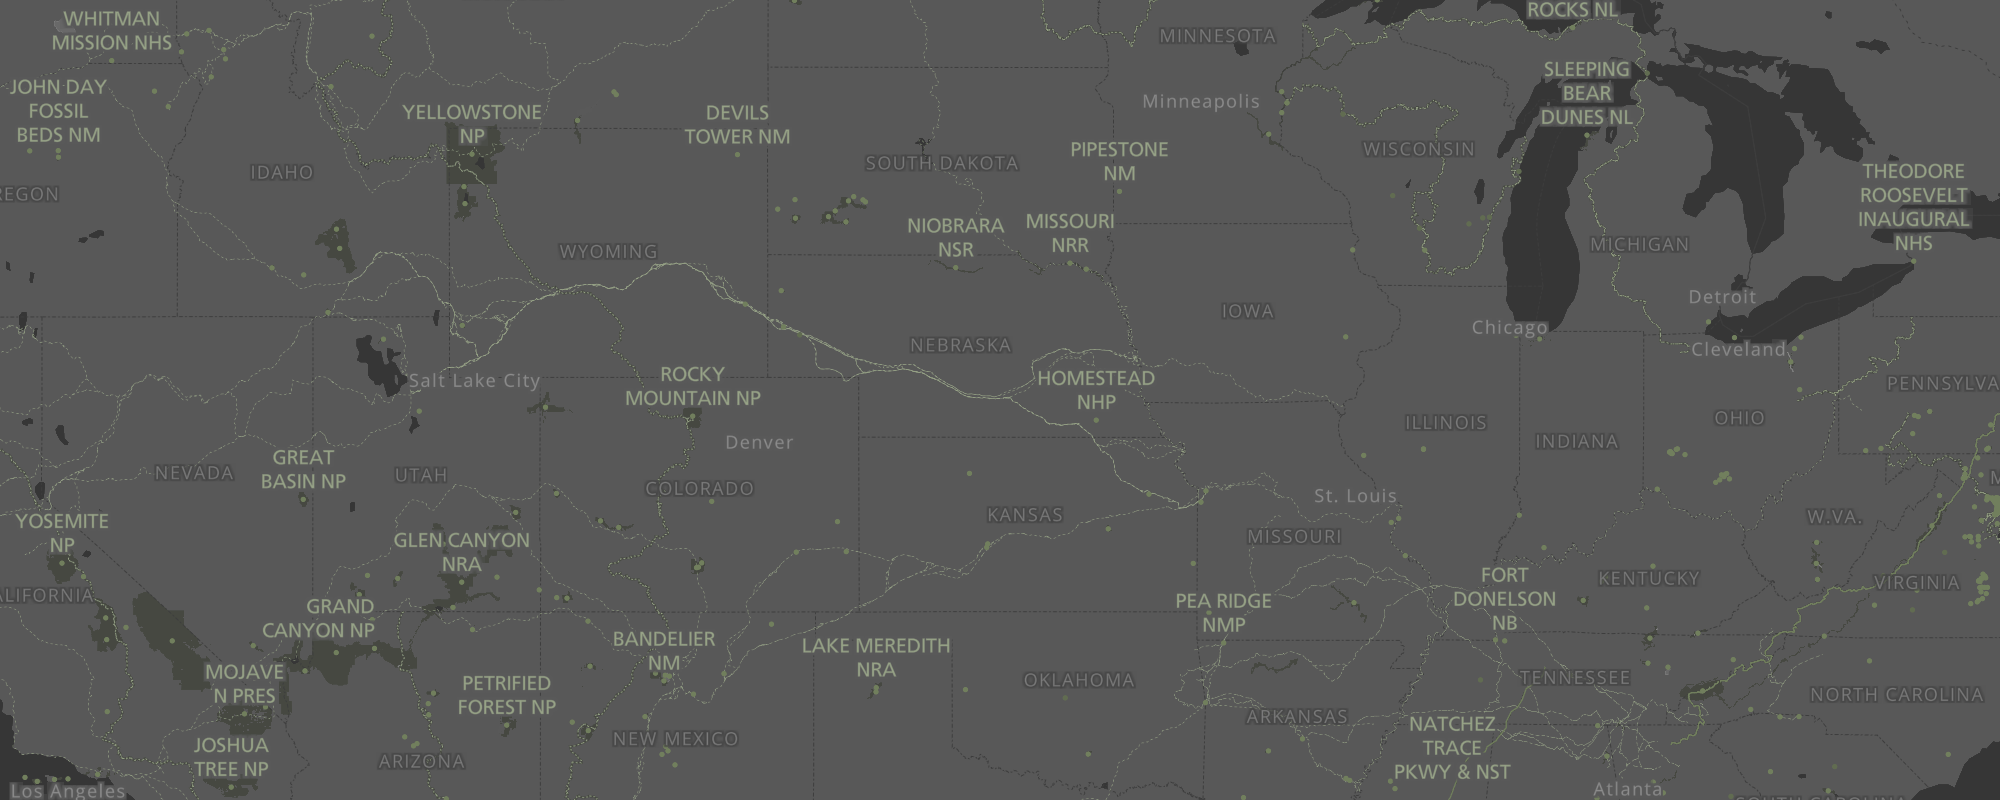
I work with numerous data stewards across the agency to develop the enterprise datasets that feed into Park Tiles. We compile data from a variety of sources into our Park Tiles database, a PostgreSQL database extended with PostGIS, and publish as vector tiles. With vector tiles in place, I determine the visual properties of all data in the basemap to achieve proper visual hierarchy and balance, enabling map users to quickly identify important features. Park Tiles Standard is the most-frequently viewed version of our map. Click the image below to view Park Tiles Slate, which is now the dark-mode basemap in the NPS Mobile App. We also support satellite imagery and light versions.
2023 & 2024 Solar Eclipses
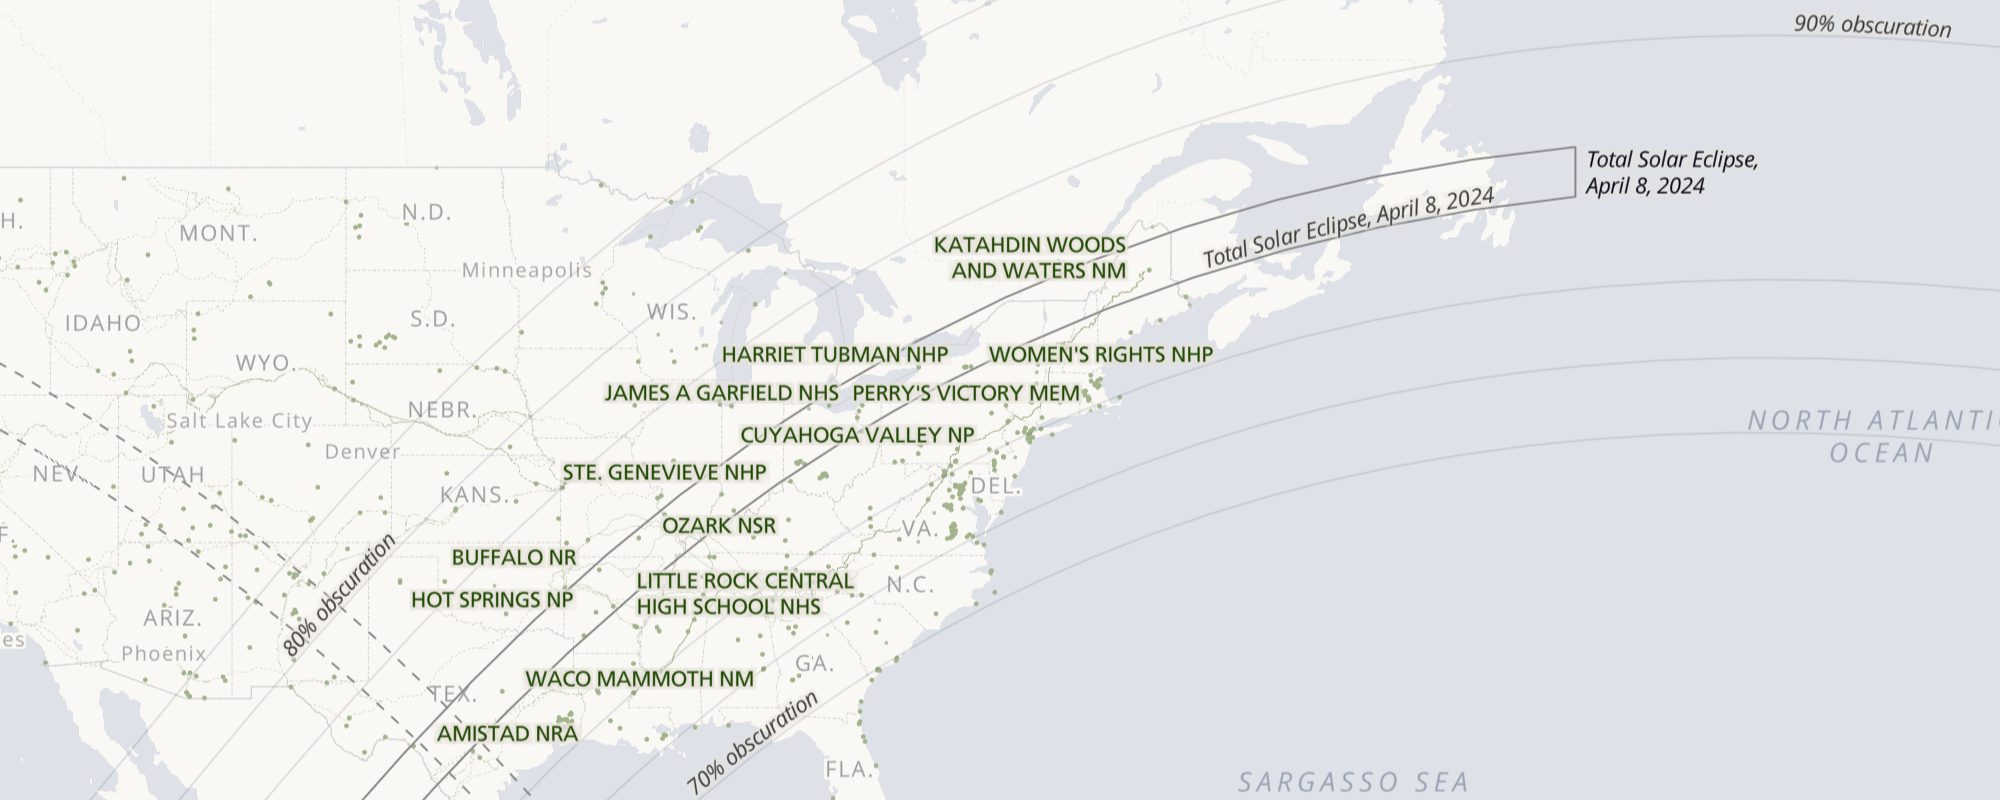
2023. Vector web map comprised of a custom NPMap.js configuration and the Park Tiles Light basemap. Uses data provided by NASA. Click image to view on NPS.gov.
Staff from the Natural Resource Stewardship & Science Directorate worked with us to produce a map that could direct visitors to parks in the paths of eclipse events and offering special programs. My rendering of NASA-provided data emphasizes simplicity, quickly directing viewers to the map's most salient features. Park labels contrast sharply with the light version of the Park Tiles basemap and are interactive; clicking on a label opens a popup with a link to park-specific program information. Eclipse path and obscuration areas are clearly labeled. I set the map symbolization for the custom map configuration using the Mapbox GL JS Style Specification.
Juan Bautista de Anza National Historic Trail
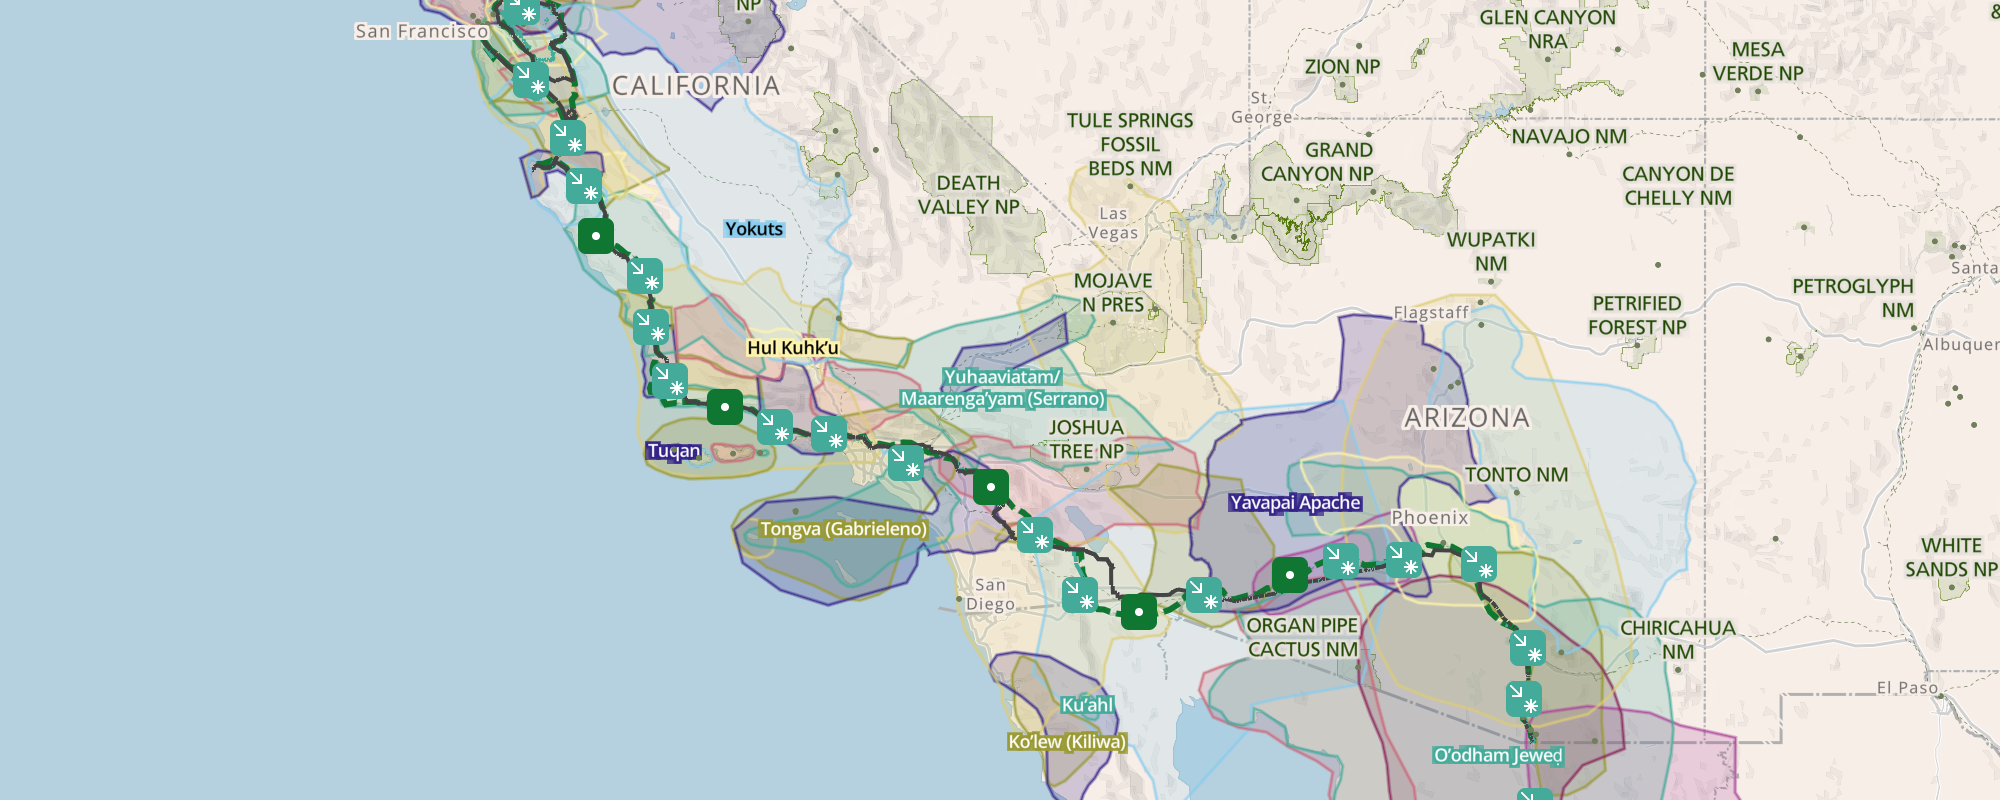
2024. Vector web map comprised of a custom NPMap5 configuration and the Park Tiles basemap. Uses data provided by trail staff and Indigeous land data from Native-Land.ca. Click image to view on NPS.gov.
Staff at Juan Bautista de Anza National Historic Trail needed to display a number of data layers to help tell the rich story of this trail and direct visitors to relevant recreational facilities. Trail-related data sources are hosted as NPS ArcGIS Online feature services. In addition, I've added a subset of Indigenous lands that roughly intersect with the trail. I worked with the developers on my team to create a user interface for toggling the visibility of the data layers. A notable update to the map is currently in progress.
Amtrak Trails & Rails
2019–current. Vector web map comprised of a custom NPMap.js configuration and the Park Tiles Standard basemap. Uses data provided by Amtrak. Click image to view on NPS.gov
The National Trails and Rails Program needed a map to quickly show which Amtrak routes had volunteer-led interpretive programs. This was one of my team's earliest attempts at truly integrating GL-enabled data overlays and styling into a custom map. By using the robust capabilities of the Mapbox GL Style Specification, I could adopt cartographic conventions found in transit maps, like parallel offset lines that indicate routes that share a common right-of-way. This also provides for greater range of labeling properties.
Yellowstone Live
The Yellowstone Live project is comprised of a series of wall monitors, interactive kiosks, and web maps that convey current conditions at the park to visitors. An initial version had been in operation for a couple of years when, in the spring of 2017, park staff determined that some of the colors used in the application might not be accessible to color-blind viewers. In addition, colors selected to convey "open" vs. "closed" were not used in a consistent way across the various displays. Specifically for the road status map, park staff also requested a unified set of road symbols that would elimniate the need to toggle different map states with radio buttons. I assessed current conditions using the Color Oracle simulator and developed alternative color and map symbols schemes, which I helped implement in the code base once designs were finalized. I adapted the slide deck above from my presentations to park staff and the project team (view a larger version here). View the live roads map on NPS.gov.
NPS System Map
2018. Adobe Illustrator/Avenza MAPublisher. Data compiled in QGIS, including raster data manipulation.
In 2017, I took over management of my division's comprehensive map of all National Park Service units, regions, affiliated sites, national trails, national rivers, and national heritage areas. In doing so, I shifted the workflow over to MAPublisher to give me greater flexibility for cartographic symbolization and overall layout design.
In 2021, a version of this map was included in Mapping America's National Parks, published by Esri Press.